
How to Download Your Plant's Electricity Data from KEPCO
Key summary
You can download 15-minute interval usage curves from KEPCO's PowerPlanner. Older data isn't kept indefinitely, so if you don't download it now, it can't be recovered later. This piece covers the gap between metered values and billed usage, and which month to check first.
Electricity costs · September 3, 2026 · 6 min read
Contents (8)
To cut a factory's electricity bill you need an hour-by-hour history of use, not a single bill. KEPCO provides that data through PowerPlanner, and with an account you can see the load curve at 15-minute resolution. The most important point in this piece, however, is that past data is not kept indefinitely.
The conclusion first
You can look up the consumption curve at 15-minute resolution on KEPCO PowerPlanner. But the retention period is not unlimited and the oldest intervals are pushed out and disappear, so if you do not download it now, later you will not be able to. And because this data is measured values, it does not match the consumption on your bill exactly. Use it without knowing about that gap and your calculations will come out wrong.
Where do we get our plant's electricity usage data?
From KEPCO's PowerPlanner. There you can look up and download the usage history and load curve for each site. Billed amounts and charge breakdowns are checked on KEPCO's Cyber Branch, so in practice you use both.
The two are different in character. The Cyber Branch shows you the billed result, while PowerPlanner is closer to the raw data that result came from.
If you have spotted something odd on your bill, check it on the Cyber Branch; if you want to work out why it came out that way, you need PowerPlanner data (how to read your bill).
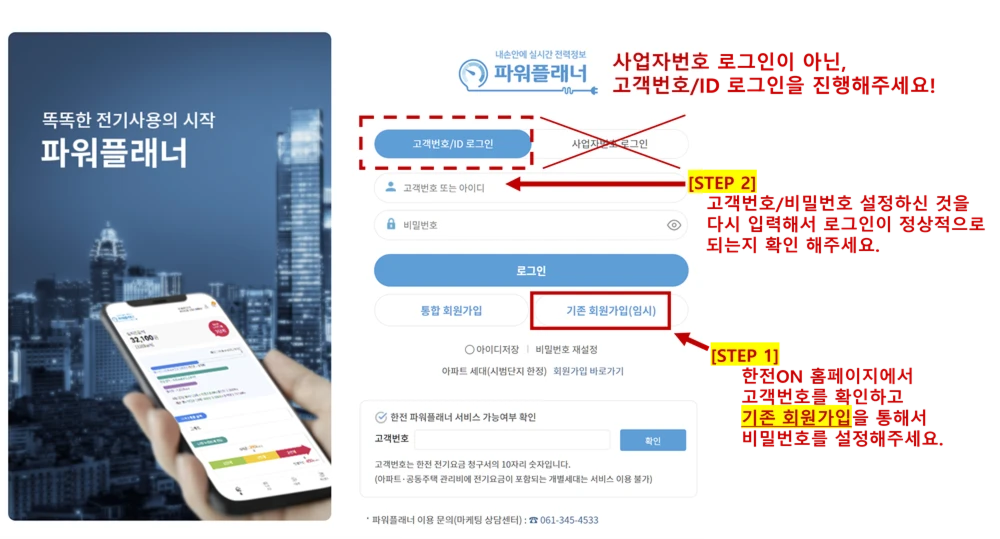
What resolution can we see?
Down to a load curve at 15-minute resolution. A day is recorded as 96 points, so you can match a spike in load against a specific process down to the hour and minute. This is the form we confirmed by collecting it directly from a high-voltage AMI account (on our own observation, June 2026).
Recording interval of the load curve
Number of points recorded in a day
Gap between measured consumption and billed consumption
Our own measurement, 2026.07
This 15-minute interval is not a screen setting but the metering interval laid down in the Terms. Article 6, item 10 of the Basic Terms of Supply defines maximum demand as 「최대수요전력을 계량할 수 있는 전력량계에 의하여 15분 단위로 누적 계산되는 전력」 — in English, the power accumulated in 15-minute intervals by a meter capable of measuring maximum demand (in force 1 July 2026).
So the peak that determines the basic charge is precisely this 15-minute value, and the curve you see on PowerPlanner is at the same resolution as that value.
It is easy to confuse this with 30 minutes, but 30 minutes is the metering interval for the reactive power used in the power factor calculation (Article 42(2) of the same Terms). Remember them apart: the peak is 15 minutes, power factor is 30 minutes.
How far back can we get past data?
It is not kept indefinitely. The 15-minute load curve keeps only the recent intervals, with the oldest pushed out and disappearing, and an interval that has gone is not restored however you ask for it later.
The retention range differs by voltage, and we have not secured measured records from a low-voltage account. For that reason this piece does not state a number of months.
The practical conclusion is a single one. Download the whole of it today and keep it on your company's own server.
Monthly billing history, by contrast, remains for a relatively long time. In the cases we have collected, we were able to secure monthly history going back to January 2022 (on our own collection record, as at July 2026).
What is not in the data you get?
Two things are missing.
First, billed consumption split into off-peak, mid-peak and peak is not provided. You are given measured values only, so you have to split consumption into the bands yourself.
Second, the supply start date and the days of suspended use are not provided either (from a full check of our own endpoints, August 2026).
When you split the bands yourself, use the time bands in Appendix 3, item 1 of the Basic Terms of Supply (the table of seasonal and time-band divisions, in force 1 July 2026). Summer and spring-autumn are as below, and winter was not part of the reform, so it is as before (off-peak, mid-peak and peak).
The time bands to use when splitting the bands yourself (Basic Terms of Supply, Appendix 3, item 1 and sub-item 4 of the proviso to the same item, in force 2026.07.01)
Mainland — summer and spring-autumn
- Off-peak
- 22:00~08:00
- Mid-peak
- 08:00~15:00 · 21:00~22:00
- Peak
- 15:00~21:00
Jeju — the same in all seasons
- Off-peak
- 22:00~08:00
- Mid-peak
- 08:00~16:00
- Peak
- 16:00~22:00
⚠️ If your site is in Jeju Special Self-Governing Province, you must not use the mainland bands. Sub-item 4 of the proviso to the same Appendix 3, item 1 applies the Jeju bands in the table above to Jeju customers in all seasons alike.
There is no seasonal division and the boundary times differ, so splitting on the mainland bands puts mid-peak and peak out wholesale. The times in the checklist below cannot be used as they stand in Jeju either.
Why do the measured values and the consumption on the bill differ?
PowerPlanner's measured series and actual billed consumption are 10~13% apart (our own measurement, July 2026). Use the measured values directly as consumption to recalculate charges and it will not match the bill.
So the two series are used for different purposes. Measured values for looking at patterns, billed consumption for calculating amounts. Without that distinction, a savings simulation starts out more than 10% off from the beginning.
Which months' data should we look at first?
Summer (July and August) and winter (December, January and February). For customers under Article 68(1) of the Basic Terms of Supply, the billing demand is set as the highest of the maximum demand values for the months of December, January, February, July, August and September within the preceding 12 months, plus the current month (Basic Terms of Supply, Article 68(1), in force 1 July 2026).
Peaks in March, April, May, June, October and November are not caught by the charge, except where they fall in the current month.
So the advice that "you have to manage peak all year round" goes beyond what the text requires. Once you have the data, open those six designated months first (what maximum demand is).
Why does the peak we calculated differ from the figure on the bill?
Because you took the highest value across all time bands. Only maximum demand in the mid-peak and peak bands goes into the billing demand calculation (Basic Terms of Supply, Appendix 3, item 1, sub-item 2 of the proviso).
Maximum demand in the off-peak band (22:00~08:00) is excluded, and because on public holidays both maximum demand and consumption are metered as off-peak, those are excluded too (sub-item 1 of the same proviso).
Saturdays are different. For Saturdays, sub-item 1 of the same proviso moves only the consumption in the peak band to off-peak, and does not move maximum demand.
The same sub-item 1 of the proviso, yet public holidays and Saturdays part company (Basic Terms of Supply, the proviso to Appendix 3, item 1, in force 2026.07.01)
Public holidays
- Consumption
- Metered as off-peak
- Maximum demand
- Metered as off-peak
- Billing demand
- Does not go in
The peak band on a Saturday
- Consumption
- Metered as off-peak
- Maximum demand
- Stays in its original band
- Billing demand
- Goes in
Maximum demand on a Saturday daytime stays in its original band (mid-peak or peak), so it falls within sub-item 2 of the proviso, and as a result Saturday peaks do go into the billing demand. It is only the energy charge that is calculated at the mid-peak unit price.
The common belief that "Saturdays are cheaper, so peaks are not caught either" breaks down here.
When calculating peak from the data you downloaded
- Did you exclude the 22:00~08:00 interval?
- Did you exclude public holidays (temporary public holidays are treated as weekdays)?
- Did you include Saturdays?
- Did you keep only December, January, February, July, August, September and the current month as candidates?
- If the result is below 30% of contract power, did you correct it to 30% of contract power?
These metering provisions rest on the proviso to Appendix 3, item 1 of the Basic Terms of Supply (in force 1 July 2026) and on Article 68(1), and we confirmed them against the current text KEPCO has published through its information disclosure. The public holidays meant here are those set by 「관공서의 공휴일에 관한 규정」 (the Regulations on Holidays for Government Offices), and the temporary public holidays the government designates from time to time are excluded (sub-item 3 of the same proviso).
What can we learn once we have the data?
Three things show up straight away.
What comes straight out of one set of data
- When the peak occurs — the basis for judging a contract power adjustment
- What the shares of use by time band are — the basis for choosing a tariff
- How evenly you run — load factor
Each of these continues in the procedure for reducing contract power, how to choose an optional tariff and load factor.
That said, handling 96 points × 365 days of data by hand in a spreadsheet is not realistic. Do the band separation, the comparison of measured against billed values and the application of the Article 68 window by hand every time, and the calculation mistakes end up larger than the savings.
- [Source: KEPCO Basic Terms of Supply, Article 6 (definitions), item 10 — the 15-minute metering of maximum demand, in force 2026.07.01]
- [Source: KEPCO Basic Terms of Supply, Article 68(1), Appendix 3 item 1 and sub-items 1 to 4 of the proviso to the same item, in force 2026.07.01]
- [Source: KEPCO electricity tariff table (industrial), in force 2026.04.16]
- [Source: Our own PowerPlanner collection measurements (high-voltage AMI account, full check of endpoints), 2026.06~2026.08]
Note: The number of months of 15-minute data retained is not stated as a figure in this piece, because the check by voltage is not finished. Please download and keep the intervals you need now.

OpenEnergy Editorial Team
Electricity costs
We unpack KEPCO tariff structure and cost-cutting methods in practical terms.
More on Electricity costs →Talk to an expert about your company's K-RE100 transition
Tell us about your situation and someone here will write back with the right transition route.
We use these details only to answer this enquiry.
Related articles

Related resources
All resources →- SourceDocument in Korean
ESCO Programme: Support for Energy Service Companies
Korea Energy Agency · Public institution · 2026.07
Korea Energy Agency
Public institution
2026.07
- SourceDocument in Korean
Energy Supporter: Energy Audits and Technical Guidance for SMEs
Korea Energy Agency · Public institution · 2026.07
Korea Energy Agency
Public institution
2026.07
- DownloadDocument in Korean
Electricity Use Across Korea's Semiconductor Belt
Our own resource · 2026.06
Our own resource
2026.06
- DownloadDocument in Korean
K-RE100: Five Compliance Routes Compared
Our own resource · 2026.06
Our own resource
2026.06
Stop hunting for REC, PPA and tariff prices
We send REC, SMP, carbon allowance and green premium prices, plus the Korean energy policy changes companies need to track.